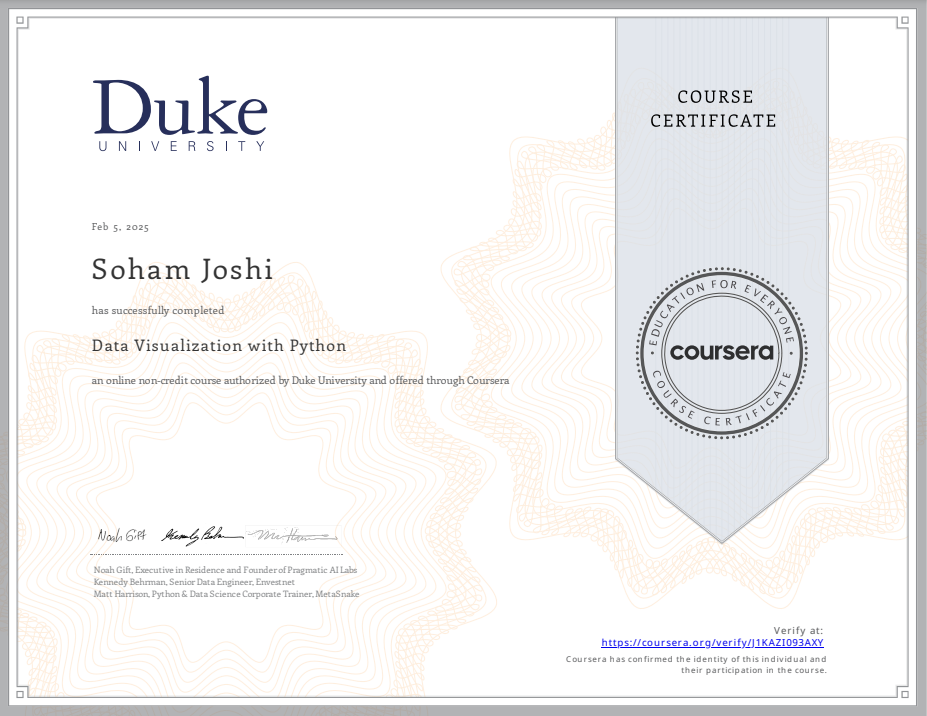
Duke University Data Visualization with Python
I effectively applied Python, spreadsheets, and BI tools to create visually compelling and interactive data visualizations.
Overview
I successfully completed the Data Visualization with Python course on Coursera, authorized by Duke University. This program provided in-depth knowledge and hands-on experience in Python, strengthening my ability to analyze and visualize data effectively to derive meaningful insights.
Key Highlights
- Apply Python, spreadsheets, and BI tools to create interactive and visually compelling data visualizations.
- Formulate and communicate data-driven insights and narratives through impactful visualizations and data storytelling.
- Assess and select the most suitable visualization tools and techniques to address organizational data needs and objectives.
Skills Gained
- Business Communication
- Data Analysis
- Python Programming
- Cloud Applications
- Data Visualization

